

How Does a Bike-Share Navigate Speedy Success?
A Google Data Analytics Capstone Project


This is a Data Analysis documentation for my Google Data Analytics Capstone Project, this Documentation will cover the following Phases of Data Analysis processes and related project documentation.
Case Study Scenario
Ask
Prepare
Process
Analyze
Share
Case Study & Scenario
Case Study Title : How Does a Bike-Share Navigate Speedy Success?
Scenario : You are a junior data analyst working in the marketing analyst team at Cyclistic, a bike-share company in Chicago. The director of marketing believes the company’s future success depends on maximizing the number of annual memberships.
Therefore, your team wants to understand how casual riders and annual members use Cyclistic bikes differently.
From these insights, your team will design a new marketing strategy to convert casual riders into annual members. But first, Cyclistic executives must approve your recommendations, so they must be backed up with compelling data insights and professional data visualizations.
Ask
Three questions will guide the future marketing program, and have been distilled into the following business task;
- How do annual members and casual riders use Cyclistic bikes differently?
- Why would casual riders buy Cyclistic annual memberships?
- How can Cyclistic use digital media to influence casual riders to become members?
I am also tasked to produce a report with the following deliverables:
- A clear statement of the business task
- A description of all data sources used
- Documentation of any cleaning or manipulation of data
- A summary of your analysis
- Supporting visualizations and key findings
- Your top three recommendations based on your analysis
Statement of Bussiness task
This analysis aims to identify and understand how the member and casual customers use Cyclistic bikes differently, and how these differences would affect casual riders buying annual memberships.
Data Sources & Organization
The data set for this case study is organized in a tabular structure of 13 columns and 4,190,052 rows(merged records). Data sets are hosted in a public domain, stored as CSV flat files and uploaded as zip files. The archive can be accessed at https://divvy-tripdata.s3.amazonaws.com/index.html
Cleaning & Manipulation documentation
--Merging of unique datasets A total of 10 unique CSV files were merged using R, resulting in a total of 13 columns and 4,190,052 rows.
--Dropping of missing values, variables and records. I calculated 658,541, 238 missing ("NA") value, 238,579 missing records(rows) and 3,951,473 complete records(row)
--Regularization of merged data Missing values and records were dropped from the dataset to make it consistent and complete.
--Adding a new variable
Four new columns with the title (month,week_day,day_n,hour, ride_length) were created with mutate() function and lubridate library to prep data ahead of visualisation, day_n was to assist sort the visuals by day of the week (Sunday - Saturday),
Checking data for integrity
This data meets the ROCC standards of integrity:
--Reliability: The sample size is above 30 and is statistically credible to reflect the overall behaviour of the total population.
--Originality: Dataset is originally provided by Motivate International Inc.
--Comprehensive: Data seems comprehensive as it provides a time stamp entry of all the related information for each unique trip, this provides the variables needed to deduce credible insight.
--Current: Data is up to date for all the months of 2020, each day across the year is captured in the dataset.
--Licensing: This project has adhered to the clauses and terms of the license provided here
Analyze
The following are problems identified and addressed in the course of analysing the data
--Missing Values and Records: A total of 238,579 missing records representing 6% of the total sample were identified and dropped.
--Measures of central tendency: Due to the possibility of extreme values the charts for ride duration were plotted using median instead of sum and average, this was employed because the median is better immune to extreme values as a statistical measure.
--Manipulation of data to create new variables
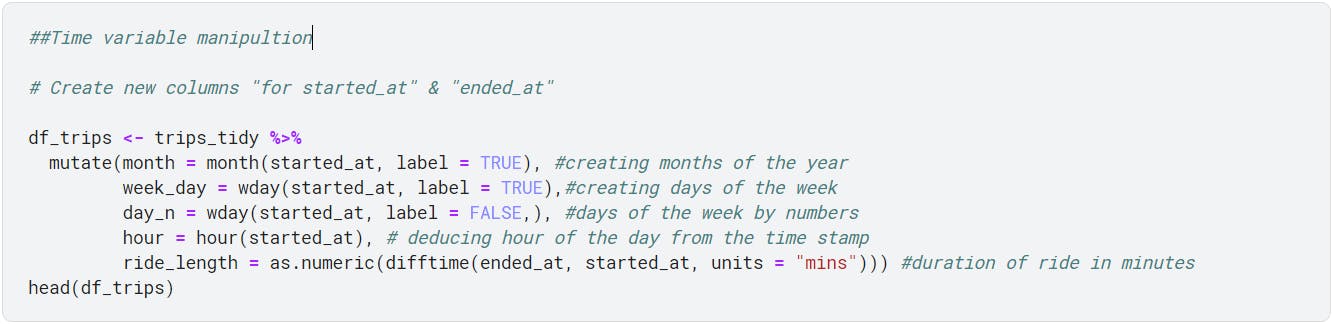
month - Months of the year as text
week_day - Days of the week as text
day_n - Days of the week as an integer
hour - Hours of the day as an integer
ride_length - Duration of ride by minutes as an integer
How does it help you answer your question?
This data set helps to answer the questions of trends amongst different metric points. As a time series data, this dataset has offered useful data points to uncover detailed insights on the activities of Bike users at hourly, daily, weekly and monthly summaries This has helped uncover the patterns amongst users to understand their preferences and motivations for using the services.
Share
The full R Notebook with the detailed codes prior to visualization can be reviewed on Kaggle
The findings of this case study are shared with the embedded Power BI report below
Conclusion If you have read this far congratulations and thank you for your time. I hope this case study was rewarding and resourceful to you, kindly leave your thoughts and observations in the comment in the comments, like and follow if you wish to hear more from echoes of data.
Cheers!